Courses
• Whether you’re a design major or looking for skills to amplify your field of study, we’ve got something for you!
Our project-based and experiential classes and degree programs help Stanford students collaborate and tackle real-world challenges.
We offer elective classes for Stanford students at all seven schools.
Course

The Design of Data - Winter 2026
Winter 2026
3 Units
Course

WHY NOW? Exploring your Work, Choices and Creativity - Winter 2026
Winter 2026
3 Units
Course

LaunchPrep: Exploring and Validating your Business Idea
Winter 2026
2 Units
Course

Community Print Shop Winter 2026
Winter 2026
3 Units
Course

Advanced Creative Studies - Winter 2026
Winter 2026
3 Units
Course

AI for Legal Help - Winter 2026
Winter 2026
3 Units
Course

Design for Healthy Behaviors - Winter 2026
Winter 2026
3 Units
Course

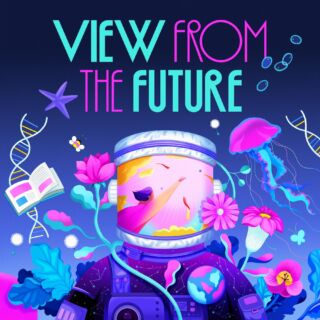
View from the Future - Winter 2026
Winter 2026
1 Units
Course

Creativity in Research Scholars - Winter 2026
Winter 2026
1 Units